Buyer School Research · Edition 1.0
AI Office-Efficiency Opportunity in Physical-Service Businesses
Where exposed office work supports work performed in person
Buyer School modeled estimate. Opportunity points are not predicted savings, profit growth, or investment returns.
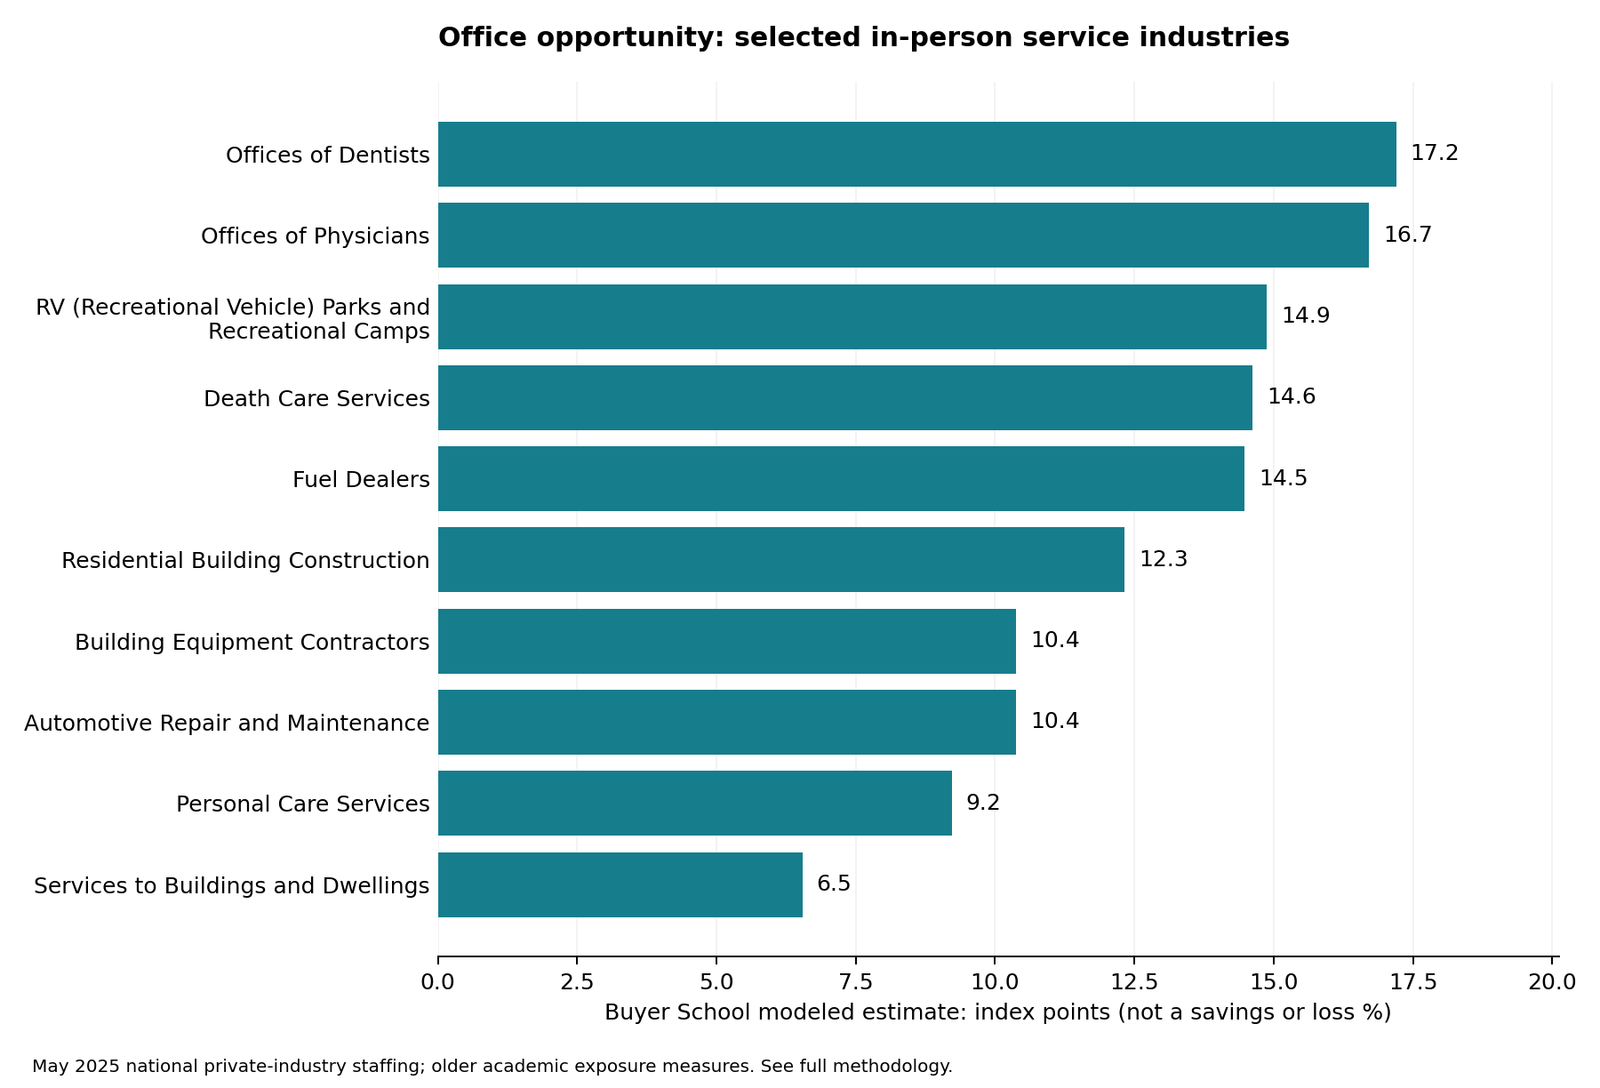
Dental offices rank first in the broad office-opportunity specification among 83 coverage-qualified industries where most employment is in in-person occupational groups, at 17.2 opportunity points (Buyer School modeled estimate). Physician offices rank second in that specification (16.7) but fall to rank 41 under a narrower definition, so the ordering depends heavily on definitions. Building equipment contractors (10.4) and automotive repair (10.4) sit mid-table at ranks 23 and 24. The index multiplies exposed office work by the share of in-person work, using BLS May 2025 staffing. It is a heuristic for where to investigate, not a measurement of realized benefit, savings or returns.
- What an opportunity point is
- The exposure contribution of designated office roles multiplied by the industry's employment share in designated in-person roles, expressed as index points. It does not estimate how much payroll can be removed.
- Cohort
- 83 industries: at least 85% matching coverage in both exposure measures, at least half of employment in the broad in-person proxy, and not in the editorial digital-service candidate set. This cohort and construct differ from the broad exposure ranking; the two scores are not one scale.
- Classification limit
- NAICS 2382 combines plumbing, HVAC, electrical and other building equipment contracting. This report cannot produce separate rankings for those trades.
- First published
- October 5, 2026
- Edition
- 1.0
- Analysis prepared
- October 4, 2026
- Staffing reference period
- May 2025 (BLS OEWS national industry staffing)
- Exposure measure vintage
- Felten, Raj and Seamans 2021 and 2023; Eloundou and coauthors 2023
The staffing data are from May 2025 and the academic exposure measures are older. Neither is a measurement of current AI capability.
Selected industries · All 83 industries · How the measure works · Limits · How to cite · Downloads
Executive finding
Dental offices lead the broad office-opportunity specification among 83 coverage-qualified industries with a majority in designated physical or in-person occupational groups. Physician offices rank second in that specification but fall to forty-first under the narrower definition. Dental offices range from first to seventh. These movements are a central result, not a detail to hide below a winner list.
Building equipment contractors and automotive repair have nearly identical broad opportunity scores: 10.4 points after rounding, a Buyer School modeled estimate. Neither category tops the ranking. Their appeal in this report is a visible combination of office work and in-person service, which can be tested against an acquisition target's actual workflows.
Selected industries relevant to acquisition diligence
This is an editorial selection from the complete 83-industry qualified cohort, not a ranked list of the best businesses to buy. Every table number is a Buyer School modeled estimate. The full broad ranking includes airlines, utilities, and manufacturing, so the overall cohort should not be marketed as a universe of small acquisition targets.
| NAICS | Industry | Opportunity points | Broad rank (of 83) | Best rank | Worst rank |
|---|---|---|---|---|---|
| 6212 | Offices of Dentists | 17.2 | 1 | 1 | 7 |
| 6211 | Offices of Physicians | 16.7 | 2 | 2 | 41 |
| 7212 | RV (Recreational Vehicle) Parks and Recreational Camps | 14.9 | 3 | 3 | 7 |
| 8122 | Death Care Services | 14.6 | 4 | 3 | 4 |
| 4572 | Fuel Dealers | 14.5 | 5 | 2 | 5 |
| 2361 | Residential Building Construction | 12.3 | 13 | 10 | 23 |
| 2382 | Building Equipment Contractors | 10.4 | 23 | 17 | 23 |
| 8111 | Automotive Repair and Maintenance | 10.4 | 24 | 18 | 28 |
| 8121 | Personal Care Services | 9.2 | 38 | 9 | 38 |
| 5617 | Services to Buildings and Dwellings | 6.5 | 68 | 45 | 69 |
See all 83 industries in the cohort.
2361 Residential Building Construction 12.3 13 10 23 2382 Building Equipment Contractors 10.4 23 17 23 8111 Automotive Repair and Maintenance 10.4 24 18 28 The rank range covers three models: narrow office/narrow in-person roles, broad office/broad in-person roles, and the broad roles using Eloundou's alternative exposure measure. The cohort stays fixed. These ranges are model sensitivity, not statistical confidence intervals.
How the opportunity measure works
The narrow office definition includes SOC 43, office and administrative support. The broad office definition adds SOC 11 and 13, management and business/financial occupations. Management includes work such as supervision that may not be office automation; its inclusion is an intentionally generous sensitivity assumption.
The narrow in-person proxy includes SOC 31, 35, 37, 39, 45, 47, 49, 51, and 53. The broad proxy adds health practitioners, SOC 29, and protective services, SOC 33. Occupational group membership is not proof that every task is physical or protected from AI. Some transport, production, and service tasks are automated in other ways.
For each industry, first sum occupation employment shares multiplied by their relative language-exposure percentile, restricted to the designated office roles. Multiply that office exposure contribution by the published employment share in the designated physical/in-person roles. Express the result as index points. The product rewards a combination of exposed support work and an in-person delivery base; it does not estimate how much payroll can be removed.
Qualification requires at least 85% matching coverage in both main and alternative measures, at least half of industry employment in the broad in-person proxy, and exclusion from the editorial digital-service candidate set. This screen is not a moat measure, a robotics forecast, or proof that customer demand is protected.
The robust part of the finding
Dental offices rank first in the broad model and seventh in the narrow one; death care ranks between third and fourth. Fuel dealers range from second to fifth. Those are more stable examples than physician offices, which range from second to forty-first, or other ambulatory health services, which range from seventh to seventy-seventh. All ranks are Buyer School modeled estimates within the 83-industry cohort.
The healthcare movements reflect a definition change as well as office work. Adding SOC 29 counts practitioners and hygienists as in-person work; excluding them sharply changes the physical share. This illustrates why a physical-office combination is a buyer research construct rather than an official measure of benefit.
Why trades can be promising without topping the table
Building equipment contractors, NAICS 2382, have 10.2% of published employment in office and administrative support and 74.3% in the broad in-person proxy. Automotive repair, NAICS 8111, has corresponding shares of 10.1% and 74.8%. These are Buyer School modeled estimates from national staffing, not typical-small-shop staffing.
A lower office share can reduce the size of an administrative opportunity even when frontline work is difficult for language software to perform. For a small shop, the owner's unrecorded estimating or scheduling work may be the bottleneck. OEWS cannot reveal that work because self-employed owner labor is excluded. A low national score therefore cannot rule out a valuable local improvement.
NAICS 2382 includes plumbing, HVAC, electrical, and other building equipment contracting. This four-digit report cannot produce separate HVAC, plumbing, or electrical rankings. Services to buildings and dwellings, NAICS 5617, similarly combines different activities. National industry mix should guide questions, then yield to target-company facts.
What an acquisition buyer should test
| Workflow | Potential operating change | Required evidence | Measure after a pilot |
|---|---|---|---|
| Lead response and scheduling | Draft replies, classify requests, and suggest appointments | Call and inquiry history; escalation rules | Qualified lead response time and booked appointments |
| Estimating | Assemble quote drafts from approved price books | Job scope, labor standards, parts records, and reviewer authority | Quote cycle time, corrections, and realized gross margin |
| Billing and collections | Draft invoices and follow-up messages | Completion records, payment terms, and dispute history | Days to invoice, rework, and overdue balances |
| Dispatch | Summarize job information and suggest assignments | Skill requirements, location data, customer windows | Travel time, repeat visits, and schedule changes |
| Customer service | Retrieve approved information and prepare responses | Knowledge quality and exception rules | Resolution quality, escalation, and complaint rates |
| Documentation | Draft job or visit summaries for human review | Reliable source notes and required approvals | Review time and error rates |
These are author-proposed workflows, not observed savings from the staffing model. Correctness and accountability remain part of the process. Clinical or safety decisions require applicable professional oversight; an administrative opportunity does not authorize automating regulated decisions.
Dental offices
The industry combines substantial support employment with services performed in person. Scheduling, reminder preparation, claim-document organization, and routine correspondence are candidates for examination. Verify cancellations, collection delays, staffing, system access, and actual process quality. Do not infer clinical automation, a transferable patient relationship, or ownership eligibility from the score.
Building equipment contractors
An AI drafting tool can help assemble a quote, but it does not inspect the site or establish that the labor allowance is correct. Require review against actual job costs. Quoting faster without accuracy can accelerate margin leakage. For an acquisition, documented estimate-to-actual performance matters more than a demonstration of fluent prose.
Automotive repair
Customer communication and invoice preparation may be exposed support work. The value depends on reliable diagnostic and parts information, technician availability, approvals, and repair quality. The broad industry includes shops with different equipment and service models; no index replaces diligence on technician retention and bay utilization.
Death care and recreation
Death care and RV parks/recreational camps appear relatively high in the broad model. Scheduling and correspondence may be candidates, but customer trust, seasonal demand, property maintenance, and the sensitivity of interactions still shape performance. The RV-park result must not be transferred to manufactured-housing communities; those are different industry categories and business models.
A savings bridge with explicit assumptions
Exposure scores do not supply a time-saving rate. Build a workflow-specific scenario using eligible labor cost, the share of time spent on the selected tasks, an assumed task-time improvement, a realization factor, and recurring implementation costs. The realization factor measures whether saved time can actually reduce cost or support paid additional work.
Illustrative formula: net annual cash benefit = eligible annual labor cost x task-time share x assumed time improvement x cash realization - recurring software, review, and integration costs. Treat implementation spending separately when calculating first-year cash flow. This formula is an educational scenario, not a valuation recommendation.
In an intentionally hypothetical example, annual eligible labor cost of $200,000, a task-time share of 30%, assumed improvement of 25%, and cash realization of 50% yield $7,500 before recurring costs. If those costs are $6,000, annual net cash benefit is $1,500. Every dollar and percentage in this example is a Buyer School modeled estimate based on invented inputs, not an industry benchmark. At zero cash realization, net recurring benefit becomes negative $6,000.
The lesson is that reduced task time is not automatically reduced payroll. Savings can disappear into review work, unused capacity, integration costs, or customer price concessions. Additional revenue requires demonstrated demand and delivery capacity; do not count both labor removal and extra output from the same released hours without reconciliation.
Evidence for benefit, and evidence against overconfidence
A study of a customer-support AI deployment reported a 15% average productivity improvement measured by issues resolved per hour, with heterogeneous effects. That is measured evidence in a particular setting, not a coefficient for dental offices or contractors. [S8]
An experiment on knowledge work found improvement on some tasks and worse correctness on a task outside the tested technology's capability frontier. That supports workflow-specific testing and human review, not blanket automation. Neither study establishes the cash conversion assumed in the example above. [S9]
Acquire the current business, evaluate the improvement separately
Underwrite verified current cash flow. List proposed AI improvements as a separate plan with owners, process changes, costs, operational measures, and downside cases. If the seller already captured a gain, reconcile it to payroll and expenses before crediting it again. If the gain is unproven, the score alone does not justify including it in debt-service coverage.
An office-opportunity score is useful for choosing where to investigate. It cannot establish purchase price, financing eligibility, the amount of an add-back, or a buyer's ability to implement the system.
Actual adoption is a separate question
For the period ending May 3, 2026, Census reported business AI use of 19.8% nationally, 39.7% in information, and 33.9% in finance and insurance. These are dated measured survey estimates, not four-digit industry forecasts. [S6]
Census broadened its AI-use question on November 17, 2025 to cover any business function. Earlier and later series should not be compared as though the question stayed constant. [S6 question-change documentation]
We do not merge those rates into the industry model. Exposure, reported use, successful implementation, and captured profit remain separate quantities. This edition does not report the latest October adoption wave or estimate an adoption gap.
Limits that must travel with the ranking
Exposure measures were constructed earlier than the staffing release. This is a 2026 publication using May 2025 staffing and older academic capability measures, not a new evaluation of October 2026 models. National industry staffing includes firms of many sizes. Outsourced administrative work and owner labor may be absent. The proxy does not measure competitive entry, customer bargaining power, data readiness, implementation skill, robotics, regulation, or the quality of a particular provider.
Matched employment is an incomplete subset. The download includes an opportunity upper envelope obtained by assigning the highest possible exposure to all uncovered employment before applying the same observed in-person factor. It is deliberately conservative and is not a confidence interval. Rankings based on the observed contribution may change under missing-data assumptions.
What the data measure
The original proposal treated government data and academic data as opposites. They are different kinds of primary evidence: BLS and Census supply official statistics, while the exposure researchers supply original academic measures. Neither government staffing nor academic exposure by itself predicts business failure.
Felten's occupational index connects AI applications to O*NET abilities. Eloundou's alternative evaluates tasks. We convert each occupational exposure measure to its percentile within that source's occupation list, then weight it by published industry employment. A percentile is a relative standing, not a percentage of tasks that AI can perform. The two measures retain different concepts even after normalization. [S2-S4, S7]
BLS supplies staffing by industry, not an acquisition-target sample. We use May 2025 national private-ownership estimates and detailed occupations, avoiding overlapping total, major, minor, and broad rows. OEWS excludes self-employed workers and does not isolate small firms. Owner work, outsourced bookkeeping, subcontractors, and differences between branches and firms can materially alter a real target's exposure. [S1]
The raw BLS file contains 247 industry groups. After removing composites, broader groups, and government designations, 211 strict four-digit private industries remain. Of those, 137 pass the joint 85% employment-matching gate for the main language measure and the independent task-based alternative. The full download retains the other industries with unranked flags. These counts describe this analysis, not the earlier 152-industry series. The supplied earlier research pack does not include that roster; this edition must not be presented as covering the same 152 industries.
The government employment counts are source statistics. All calculated scores, shares, ranks, rank ranges, and coverage measures are labeled Buyer School modeled estimate. Excluded observations are missing, not zero. The reported rank ranges reflect specified model changes; they are not statistical confidence intervals.
Educational scope and disclosure
Buyer School is an educational research site. This report provides general information and modeled comparisons, not individualized investment, lending, legal, tax, employment, or acquisition advice. It does not recommend purchasing or avoiding a particular business. Industry averages do not establish a target company's results. Verify material assumptions with company records and qualified professionals before acting.
Buyer School produces acquisition education and may benefit commercially from readership. The model was prepared with AI assistance and programmatic calculations from public sources. It has not received independent practitioner or academic review. No transaction, employee, customer, or private-company data were used. No causal effect of AI on revenue, enterprise value, or employment is estimated.
Suggested citation
Buyer School (2026). AI Office-Efficiency Opportunity in Physical-Service Businesses, edition 1.0, October 4. Buyer School modeled estimates using BLS OEWS May 2025 and Felten et al. occupational exposure, with Eloundou et al. sensitivity. Cite the public report URL and dataset version once published.
All 83 industries in the cohort
| Broad rank | NAICS | Industry | Opportunity points | Best rank | Worst rank | Office and administrative support share (%) | Broad in-person share (%) |
|---|---|---|---|---|---|---|---|
| 1 | 6212 | Offices of Dentists | 17.2 | 1 | 7 | 28.1 | 68.7 |
| 2 | 6211 | Offices of Physicians | 16.7 | 2 | 41 | 25.0 | 64.8 |
| 3 | 7212 | RV (Recreational Vehicle) Parks and Recreational Camps | 14.9 | 3 | 7 | 20.8 | 56.6 |
| 4 | 8122 | Death Care Services | 14.6 | 3 | 4 | 18.6 | 63.4 |
| 5 | 4572 | Fuel Dealers | 14.5 | 2 | 5 | 22.1 | 61.1 |
| 6 | 2213 | Water, Sewage and Other Systems | 13.8 | 6 | 6 | 20.0 | 58.7 |
| 7 | 6219 | Other Ambulatory Health Care Services | 13.8 | 7 | 77 | 13.8 | 67.2 |
| 8 | 4884 | Support Activities for Road Transportation | 13.7 | 3 | 8 | 18.5 | 72.1 |
| 9 | 4811 | Scheduled Air Transportation | 13.4 | 1 | 9 | 24.9 | 68.6 |
| 10 | 4812 | Nonscheduled Air Transportation | 13.3 | 10 | 19 | 12.3 | 62.2 |
| 11 | 4889 | Other Support Activities for Transportation | 12.7 | 8 | 11 | 19.6 | 58.8 |
| 12 | 4883 | Support Activities for Water Transportation | 12.7 | 12 | 16 | 11.4 | 70.1 |
| 13 | 2361 | Residential Building Construction | 12.3 | 10 | 23 | 12.1 | 57.3 |
| 14 | 6213 | Offices of Other Health Practitioners | 12.0 | 14 | 54 | 20.9 | 55.0 |
| 15 | 2362 | Nonresidential Building Construction | 11.8 | 9 | 58 | 7.2 | 55.1 |
| 16 | 8134 | Civic and Social Organizations | 11.3 | 16 | 32 | 11.9 | 59.3 |
| 17 | 5629 | Remediation and Other Waste Management Services | 11.2 | 15 | 20 | 11.0 | 67.5 |
| 18 | 8114 | Personal and Household Goods Repair and Maintenance | 11.1 | 10 | 19 | 14.0 | 70.4 |
| 19 | 4245 | Farm Product Raw Material Merchant Wholesalers | 10.8 | 16 | 21 | 13.9 | 60.2 |
| 20 | 7113 | Promoters of Performing Arts, Sports, and Similar Events | 10.8 | 20 | 64 | 8.7 | 52.1 |
| 21 | 7213 | Rooming and Boarding Houses, Dormitories, and Workers' Camps | 10.6 | 12 | 30 | 13.3 | 71.4 |
| 22 | 3231 | Printing and Related Support Activities | 10.5 | 14 | 22 | 16.0 | 60.8 |
| 23 | 2382 | Building Equipment Contractors | 10.4 | 17 | 23 | 10.2 | 74.3 |
| 24 | 8111 | Automotive Repair and Maintenance | 10.4 | 18 | 28 | 10.1 | 74.8 |
| 25 | 8129 | Other Personal Services | 10.3 | 25 | 38 | 9.2 | 73.9 |
| 26 | 8113 | Commercial and Industrial Machinery and Equipment (except Automotive and Electronic) Repair and Maintenance | 10.2 | 24 | 32 | 10.7 | 67.9 |
| 27 | 3111 | Animal Food Manufacturing | 10.1 | 27 | 35 | 10.0 | 69.8 |
| 28 | 5621 | Waste Collection | 10.1 | 13 | 28 | 11.4 | 79.4 |
| 29 | 2389 | Other Specialty Trade Contractors | 10.0 | 27 | 30 | 8.4 | 77.6 |
| 30 | 2383 | Building Finishing Contractors | 9.9 | 23 | 30 | 8.8 | 76.3 |
| 31 | 2381 | Foundation, Structure, and Building Exterior Contractors | 9.8 | 24 | 36 | 7.9 | 77.4 |
| 32 | 2379 | Other Heavy and Civil Engineering Construction | 9.8 | 25 | 52 | 5.9 | 71.9 |
| 33 | 4852 | Interurban and Rural Bus Transportation | 9.7 | 11 | 33 | 13.1 | 76.5 |
| 34 | 8112 | Electronic and Precision Equipment Repair and Maintenance | 9.7 | 34 | 38 | 13.0 | 50.9 |
| 35 | 5622 | Waste Treatment and Disposal | 9.5 | 31 | 37 | 10.4 | 66.8 |
| 36 | 3149 | Other Textile Product Mills | 9.5 | 22 | 36 | 12.3 | 67.7 |
| 37 | 2371 | Utility System Construction | 9.3 | 31 | 46 | 6.2 | 76.7 |
| 38 | 8121 | Personal Care Services | 9.2 | 9 | 38 | 11.9 | 80.7 |
| 39 | 4231 | Motor Vehicle and Motor Vehicle Parts and Supplies Merchant Wholesalers | 9.1 | 39 | 40 | 13.6 | 51.0 |
| 40 | 3241 | Petroleum and Coal Products Manufacturing | 9.1 | 40 | 70 | 5.5 | 63.3 |
| 41 | 5612 | Facilities Support Services | 8.9 | 41 | 47 | 7.9 | 71.4 |
| 42 | 2123 | Nonmetallic Mineral Mining and Quarrying | 8.9 | 33 | 47 | 9.3 | 78.2 |
| 43 | 7139 | Other Amusement and Recreation Industries | 8.9 | 28 | 45 | 9.6 | 71.2 |
| 44 | 3112 | Grain and Oilseed Milling | 8.8 | 44 | 51 | 7.1 | 72.4 |
| 45 | 2373 | Highway, Street, and Bridge Construction | 8.8 | 39 | 56 | 5.2 | 79.5 |
| 46 | 3152 | Cut and Sew Apparel Manufacturing | 8.8 | 34 | 46 | 12.2 | 59.5 |
| 47 | 4851 | Urban Transit Systems | 8.6 | 25 | 47 | 8.3 | 82.8 |
| 48 | 3222 | Converted Paper Product Manufacturing | 8.6 | 42 | 48 | 8.2 | 76.1 |
| 49 | 2131 | Support Activities for Mining | 8.5 | 48 | 56 | 6.0 | 74.9 |
| 50 | 4862 | Pipeline Transportation of Natural Gas | 8.4 | 50 | 79 | 3.7 | 63.9 |
| 51 | 3122 | Tobacco Manufacturing | 8.2 | 50 | 55 | 7.8 | 64.4 |
| 52 | 4931 | Warehousing and Storage | 8.2 | 37 | 52 | 10.7 | 80.4 |
| 53 | 3119 | Other Food Manufacturing | 8.2 | 49 | 53 | 7.0 | 76.5 |
| 54 | 3314 | Nonferrous Metal (except Aluminum) Production and Processing | 7.8 | 54 | 65 | 6.3 | 72.5 |
| 55 | 3312 | Steel Product Manufacturing from Purchased Steel | 7.6 | 55 | 61 | 6.8 | 73.7 |
| 56 | 3114 | Fruit and Vegetable Preserving and Specialty Food Manufacturing | 7.5 | 56 | 58 | 6.1 | 80.4 |
| 57 | 1152 | Support Activities for Animal Production | 7.5 | 40 | 63 | 7.5 | 73.3 |
| 58 | 4821 | Rail Transportation | 7.5 | 58 | 66 | 4.2 | 83.5 |
| 59 | 3115 | Dairy Product Manufacturing | 7.4 | 53 | 59 | 6.6 | 78.5 |
| 60 | 3221 | Pulp, Paper, and Paperboard Mills | 7.4 | 60 | 72 | 5.1 | 74.4 |
| 61 | 3262 | Rubber Product Manufacturing | 7.3 | 59 | 61 | 6.2 | 76.1 |
| 62 | 4922 | Local Messengers and Local Delivery | 7.2 | 29 | 62 | 13.6 | 81.0 |
| 63 | 3313 | Alumina and Aluminum Production and Processing | 7.1 | 62 | 67 | 5.8 | 74.6 |
| 64 | 1133 | Logging | 7.1 | 21 | 70 | 8.8 | 83.1 |
| 65 | 4832 | Inland Water Transportation | 7.1 | 59 | 65 | 4.7 | 83.2 |
| 66 | 3121 | Beverage Manufacturing | 6.9 | 66 | 74 | 4.5 | 69.4 |
| 67 | 3132 | Fabric Mills | 6.7 | 63 | 67 | 6.2 | 75.5 |
| 68 | 5617 | Services to Buildings and Dwellings | 6.5 | 45 | 69 | 5.8 | 85.7 |
| 69 | 6231 | Nursing Care Facilities (Skilled Nursing Facilities) | 6.5 | 69 | 74 | 4.3 | 89.1 |
| 70 | 3315 | Foundries | 6.5 | 67 | 70 | 5.1 | 79.7 |
| 71 | 8123 | Drycleaning and Laundry Services | 6.5 | 43 | 71 | 7.1 | 76.1 |
| 72 | 3113 | Sugar and Confectionery Product Manufacturing | 6.4 | 71 | 72 | 5.4 | 69.2 |
| 73 | 3211 | Sawmills and Wood Preservation | 6.2 | 50 | 73 | 5.6 | 84.8 |
| 74 | 3311 | Iron and Steel Mills and Ferroalloy Manufacturing | 6.2 | 72 | 78 | 4.4 | 73.5 |
| 75 | 4921 | Couriers and Express Delivery Services | 5.6 | 44 | 75 | 7.5 | 88.5 |
| 76 | 2122 | Metal Ore Mining | 5.5 | 76 | 81 | 3.0 | 73.2 |
| 77 | 5616 | Investigation and Security Services | 5.4 | 76 | 83 | 5.0 | 86.0 |
| 78 | 3118 | Bakeries and Tortilla Manufacturing | 5.2 | 69 | 78 | 4.7 | 78.3 |
| 79 | 1151 | Support Activities for Crop Production | 4.9 | 62 | 79 | 4.5 | 89.6 |
| 80 | 3116 | Animal Slaughtering and Processing | 4.6 | 75 | 80 | 3.8 | 90.0 |
| 81 | 3131 | Fiber, Yarn, and Thread Mills | 4.3 | 76 | 81 | 4.0 | 86.9 |
| 82 | 4854 | School and Employee Bus Transportation | 3.6 | 80 | 82 | 2.8 | 94.4 |
| 83 | 7224 | Drinking Places (Alcoholic Beverages) | 3.5 | 82 | 83 | 1.3 | 91.0 |
Sources and attribution
- [S1] U.S. Bureau of Labor Statistics, Occupational Employment and Wage Statistics, May 2025 national industry staffing tables. bls.gov/oes/tables.htm; downloaded file: oesm25in4.zip. Private ownership, detailed occupations, strict four-digit NAICS only.
- [S2] Felten, E., Raj, M., and Seamans, R. (2021). Occupational, industry, and geographic exposure to artificial intelligence: A novel dataset and its potential uses. Strategic Management Journal 42(12), 2195-2217. doi.org/10.1002/smj.3286. Author data: github.com/AIOE-Data/AIOE. The research is a primary academic source, though not a government measure.
- [S3] Felten, E., Raj, M., and Seamans, R. (2023). How will Language Modelers like ChatGPT Affect Occupations and Industries? arxiv.org/abs/2303.01157. Language and image exposure workbooks supplied by the authors. The main model uses their language-modeling occupational scores, not their already-aggregated industry rankings.
- [S4] Eloundou, T., Manning, S., Mishkin, P., and Rock, D. (2023). GPTs are GPTs: An Early Look at the Labor Market Impact Potential of Large Language Models. arxiv.org/abs/2303.10130. Author replication data: github.com/openai/GPTs-are-GPTs. Sensitivity uses human_rating_beta from data/occ_level.csv, restricted to .00 occupational records; no averaging of O*NET specialties without employment weights.
- [S5] BLS, 2010-to-2018 SOC crosswalk. bls.gov/soc/2018/crosswalks.htm. Download: soc_2010_to_2018_crosswalk.xlsx. Ambiguous multiple-parent mappings excluded.
- [S6] Grundy, A., Breaux, C., and Khatiwoda, D., U.S. Census Bureau (May 26, 2026), Large Firms With at Least 20 Employees Biggest AI Users. census.gov/library/stories/2026/05/ai-use-businesses.html. Historical context through May 3, 2026; not a latest October adoption estimate. Question change documentation: AI Question Wording Updates (PDF).
- [S7] O*NET Resource Center, database and content model. onetcenter.org/database.html. Provides occupational information underlying the academic models. This study does not rerun the original model on the current O*NET release.
- [S8] Brynjolfsson, E., Li, D., and Raymond, L. (2025), Generative AI at Work. Quarterly Journal of Economics. doi.org/10.1093/qje/qjae044. Evidence from a specific customer-support deployment; not an industry-wide savings coefficient.
- [S9] Dell'Acqua et al., Navigating the Jagged Technological Frontier. Organization Science. doi.org/10.1287/orsc.2025.21838. Task-level experimental evidence; not a forecast for acquisition targets.
How to cite this research
Buyer School (2026). AI Office-Efficiency Opportunity in Physical-Service Businesses, edition 1.0, prepared October 4, 2026. First published October 5, 2026. Business Buyer School. https://businessbuyerschool.com/research/ai-office-opportunity/. Buyer School modeled estimates using BLS OEWS May 2025 staffing and published occupational exposure measures.
- Author and publisher: Buyer School Research, the research imprint of Business Buyer School (businessbuyerschool.com), operated by Dig Inc LLC. Organizational authorship; no individual author is named.
- Attribution: describe scores, ranks, coverage figures and cohort counts as "Buyer School modeled estimate". Employment totals are BLS statistics.
- Review status: prepared with AI assistance and programmatic calculations from public sources. Not independently peer reviewed. No DOI has been assigned.
- Reuse: a data license has not been published. Short quotations of findings with attribution and a link to this page are welcome.
- Corrections and versions: see the version history. This URL stays stable across editions.
Downloads
- Report PDF: AI Office-Efficiency Opportunity in Physical-Service Businesses, edition 1.0 application/pdf
- Full dataset, 211 industries including 74 unranked (CSV) text/csv
- Full dataset, 211 industries (JSON, generated from the CSV at build time) application/json
Office-opportunity values are the benefit_* fields of the full dataset. This page is the primary version of the report; the PDF is a copy for download.
Related research
AI Exposure Across U.S. Industries: The Top 25 ranks 137 industries on occupational exposure, a different question from office opportunity.
Business Buyer School teaches first time buyers how to evaluate a small business. About the school.