Buyer School Research · Edition 2.0
AI Exposure Across U.S. Industries: The Top 25
A broader occupational comparison for business acquisition research
Buyer School modeled estimate. These scores measure relative occupational exposure, not revenue loss, job loss, savings, or business-failure probabilities.
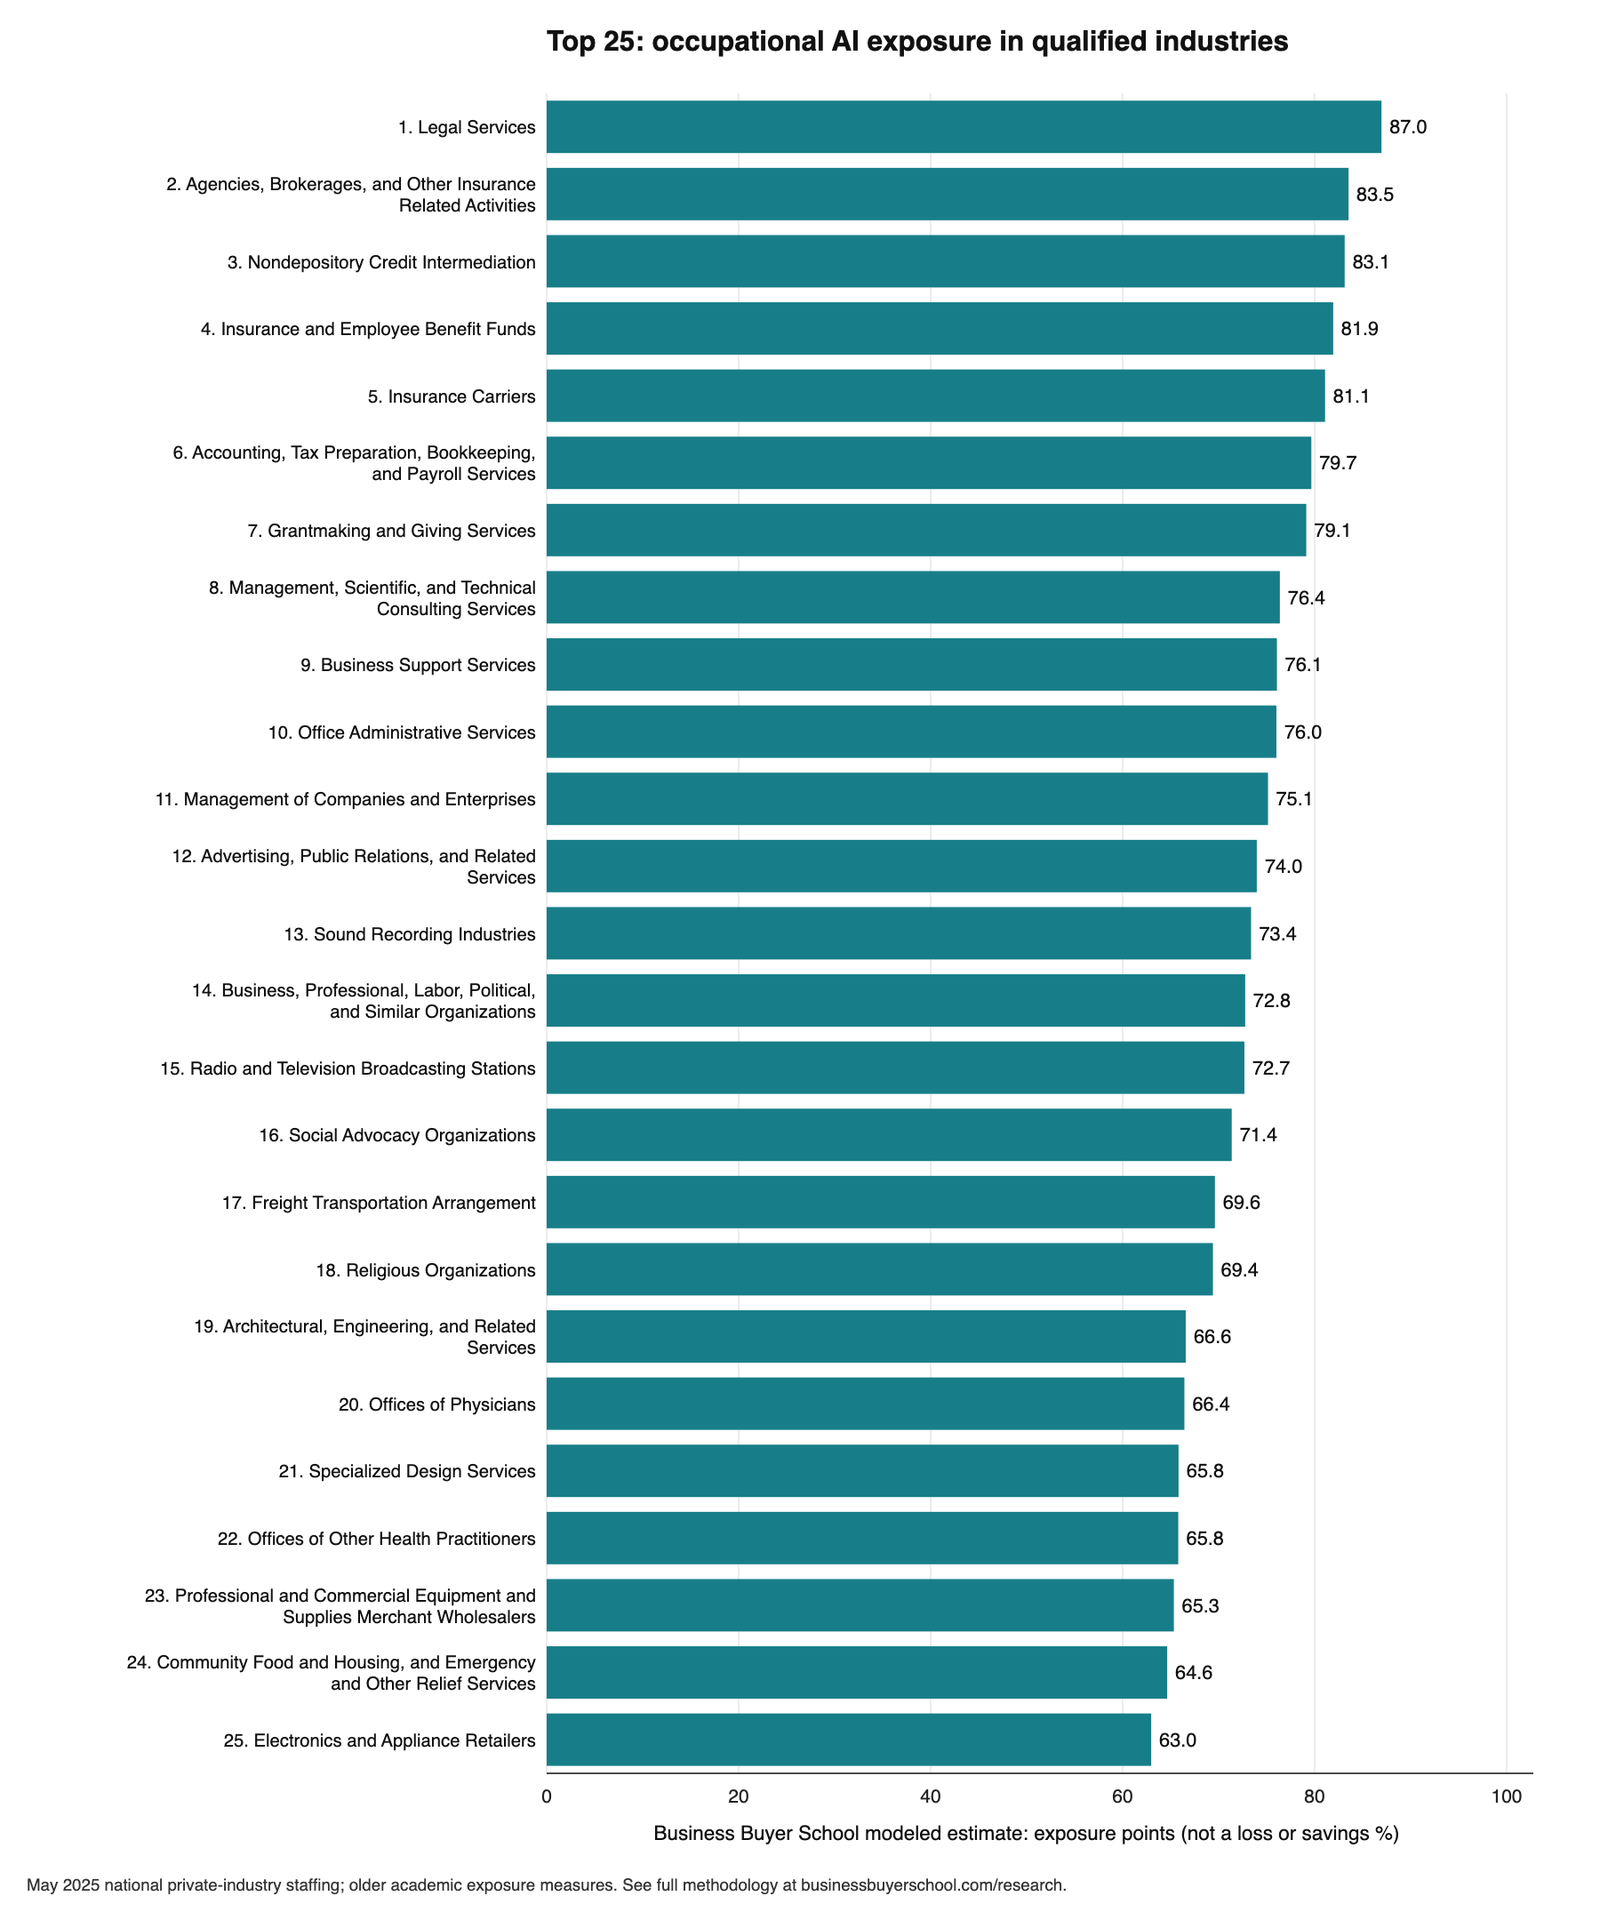
Legal services rank first of 137 coverage-qualified four-digit U.S. industries for occupational exposure to AI language models, at 87.0 exposure points (Buyer School modeled estimate). Insurance agencies and brokerages (83.5), nondepository credit intermediation (83.1), insurance and employee benefit funds (81.9) and insurance carriers (81.1) complete the first five. The ranking covers 137 of the 211 private four-digit industries in the dataset; the other 74 are unranked because too little of their employment could be matched, which is not the same as zero exposure. The score uses BLS May 2025 staffing and older published academic exposure measures. It does not forecast job loss, revenue loss, business failure or savings, and it is not a list of businesses to buy or avoid.
- What an exposure point is
- An employment-weighted average of occupational exposure percentiles (0 to 100) among an industry's matched employees. A score of 87 does not mean AI can do 87% of the industry's tasks, and it is not the industry's percentile.
- Coverage rule
- An industry is ranked only when at least 85% of its employment is matched in both the main language measure and the alternate task-based measure. 137 industries pass; 74 do not and stay visible as unranked in the data.
- Who appears
- Some categories in the top 25 are institutional or nonprofit rather than ordinary small businesses for sale. Four-digit groups also combine different trades and business models.
- First published
- October 5, 2026
- Edition
- 2.0
- Analysis prepared
- October 4, 2026
- Staffing reference period
- May 2025 (BLS OEWS national industry staffing)
- Exposure measure vintage
- Felten, Raj and Seamans 2021 and 2023; Eloundou and coauthors 2023
The staffing data are from May 2025 and the academic exposure measures are older. Neither is a measurement of current AI capability.
Top 25 table · Sensitivity checks · Notes on each of the 25 · How it is calculated · How to cite · Downloads
What this report finds
Legal services lead the main language-exposure ranking across 137 coverage-qualified four-digit industries. Insurance agencies and brokerages, nondepository credit intermediation, insurance and employee benefit funds, and insurance carriers complete the first five. Accounting-related services rank sixth.
The alternate task-based model places 22 of the same industries in its own top 25. That is a useful indication of broad agreement, although it changes the order: legal services move from first to sixth, while insurance agencies and brokerages move from second to first. All counts, scores, ranks, and model comparisons here are Buyer School modeled estimates.
This report expands the earlier nine-industry customer-facing comparison. It now examines the full coverage-qualified industry universe without the selected digital-service filter. The question is broader: where does an industry's workforce combine occupations with relatively high published AI exposure?
The resulting list includes financial institutions, nonprofits, corporate headquarters, healthcare offices, and physical-product businesses. It is deliberately not a list of the most vulnerable businesses or the best acquisition targets. Exposure is useful for identifying questions; commercial outcomes require additional evidence.
The top 25
These are the highest main-model scores among the 137 qualified industries in this dataset, not a complete ordering of all U.S. industries. The dataset retains 211 strict four-digit private industries, including 74 that remain unranked.
Exposure points are an employment-weighted average of occupational exposure percentiles among matched employees. A score of 87 does not mean that AI can perform 87% of the industry's tasks. Main coverage is matched employment as a share of total industry employment. Eligibility also requires at least 85% coverage in the alternate task model. Task-model ranks use the same 137-industry cohort.
| Rank | NAICS | Industry | Exposure points | Main coverage (%) | Task-model coverage (%) | Task-model rank | Passes 90% gate |
|---|---|---|---|---|---|---|---|
| 1 | 5411 | Legal Services | 87.0 | 97.6 | 97.5 | 6 | Yes |
| 2 | 5242 | Agencies, Brokerages, and Other Insurance Related Activities | 83.5 | 95.4 | 96.7 | 1 | Yes |
| 3 | 5222 | Nondepository Credit Intermediation | 83.1 | 89.8 | 92.8 | 3 | No |
| 4 | 5251 | Insurance and Employee Benefit Funds | 81.9 | 86.5 | 88.8 | 5 | No |
| 5 | 5241 | Insurance Carriers | 81.1 | 90.3 | 94.6 | 4 | Yes |
| 6 | 5412 | Accounting, Tax Preparation, Bookkeeping, and Payroll Services | 79.7 | 94.2 | 94.9 | 7 | Yes |
| 7 | 8132 | Grantmaking and Giving Services | 79.1 | 90.7 | 86.3 | 13 | No |
| 8 | 5416 | Management, Scientific, and Technical Consulting Services | 76.4 | 87.8 | 91.7 | 11 | No |
| 9 | 5614 | Business Support Services | 76.1 | 92.8 | 93.4 | 2 | Yes |
| 10 | 5611 | Office Administrative Services | 76.0 | 86.8 | 87.6 | 10 | No |
| 11 | 5511 | Management of Companies and Enterprises | 75.1 | 87.0 | 89.7 | 12 | No |
| 12 | 5418 | Advertising, Public Relations, and Related Services | 74.0 | 91.8 | 94.7 | 9 | Yes |
| 13 | 5122 | Sound Recording Industries | 73.4 | 89.0 | 87.5 | 15 | No |
| 14 | 8139 | Business, Professional, Labor, Political, and Similar Organizations | 72.8 | 94.5 | 90.3 | 16 | Yes |
| 15 | 5161 | Radio and Television Broadcasting Stations | 72.7 | 86.4 | 95.6 | 8 | No |
| 16 | 8133 | Social Advocacy Organizations | 71.4 | 87.8 | 85.3 | 17 | No |
| 17 | 4885 | Freight Transportation Arrangement | 69.6 | 93.9 | 93.9 | 20 | Yes |
| 18 | 8131 | Religious Organizations | 69.4 | 87.1 | 86.4 | 38 | No |
| 19 | 5413 | Architectural, Engineering, and Related Services | 66.6 | 87.7 | 93.6 | 18 | No |
| 20 | 6211 | Offices of Physicians | 66.4 | 95.9 | 90.1 | 28 | Yes |
| 21 | 5414 | Specialized Design Services | 65.8 | 86.4 | 91.0 | 21 | No |
| 22 | 6213 | Offices of Other Health Practitioners | 65.8 | 89.0 | 87.3 | 32 | No |
| 23 | 4234 | Professional and Commercial Equipment and Supplies Merchant Wholesalers | 65.3 | 86.3 | 91.3 | 14 | No |
| 24 | 6242 | Community Food and Housing, and Emergency and Other Relief Services | 64.6 | 88.3 | 87.8 | 25 | No |
| 25 | 4492 | Electronics and Appliance Retailers | 63.0 | 97.0 | 96.9 | 19 | Yes |
See all 137 ranked industries and the 74 unranked categories.
Sensitivity checks
| Check | Result | Detail |
|---|---|---|
| Alternate task-based model, same 137 industries | 22 of the main top 25 are also in the task-model top 25 | Rank correlation across all 137: 0.925. Legal services move from rank 1 to rank 6; insurance agencies and brokerages move from 2 to 1. |
| Raw language index instead of its percentile transformation | 25 of the main top 25 retained | Rank correlation across all 137: 0.998. |
| Joint coverage gate relaxed from 85% to 75% | 169 industries ranked | 18 of the main top 25 remain in that cohort's top 25. |
| Joint coverage gate tightened from 85% to 90% | 96 industries ranked | Only 10 of the main top 25 pass the stricter gate. |
| Gap between rank 25 and rank 26 | 2.4 exposure points | A descriptive separation between calculated values, not a tested difference. |
Buyer School modeled estimate. Scores and ranks are comparative constructs, not forecasts. Detailed results for all 137 ranked industries and all 211 included categories are supplied as CSV and JSON.
The strongest findings and the qualifications beside them
Information-intensive services are prominent, but workforce exposure is not confined to businesses selling digital output. Physician offices, freight arrangement, equipment wholesalers, relief services, and electronics retail also appear. Their economic channels differ: AI may alter office work, professional information work, the service sold, or several of these at once.
Membership is more stable than exact rank. Twenty-two of the main top 25 also appear in the task-model top 25. The rank correlation across all 137 industries is 0.925. Using the original raw language index instead of its occupational percentile transformation retains all 25 main selections, with a rank correlation of 0.998. These are descriptive modeled comparisons, not validation against actual company outcomes.
Coverage remains a material limitation. Relaxing the joint gate from 85% to 75% expands the cohort to 169 industries and retains only 18 of the main top 25 in that expanded cohort's top 25. Tightening the gate to 90% leaves 96 industries; only 10 of the main top 25 pass that stricter gate. The coverage-qualified headline must therefore travel with the list. The missing categories are not assumed to have low exposure.
The score gap between twenty-fifth and twenty-sixth is 2.4 points in this model. That is a descriptive separation between calculated values, not evidence that the categories differ significantly after accounting for sampling, classification, or capability uncertainty.
Why the business implication cannot be inferred from rank
| Where the exposed work sits | Possible business channel | Evidence needed from a target |
|---|---|---|
| The deliverable customers buy | Lower-cost production, customer self-service, or price competition | Service-line contracts, renewal pricing, utilization, and lost-client reasons |
| Office support around an in-person service | Faster scheduling, quoting, billing, or documentation | Workflow time, quality, labor cost, and actual cash realization |
| Accountable professional work | Better preparation or analysis with continuing review obligations | Review standards, errors, client expectations, and responsible sign-off |
| Sales and coordination around physical products | Easier information handling or changes in distribution | Customer relationships, order economics, service differentiation, and margins |
These are author-proposed interpretation channels, not measured effects. A high-exposure industry can benefit if it captures productivity gains. It can face pressure if customers or competitors capture those gains instead. Even one business may experience both.
The top 25: what to investigate in each
The following notes are educational interpretation and diligence questions. They are not additional calculations, current capability tests, or evidence of realized savings or losses. A four-digit category may combine businesses with quite different economics.
1. Legal Services - NAICS 5411
Document, analysis, and language work can be highly exposed while representation, responsibility, and trusted judgment remain important. Segment routine production from the accountable service the client pays for. The alternate task model places this industry sixth, illustrating that first place is method-dependent.
2. Insurance Agencies and Brokerages - NAICS 5242
Application preparation, policy comparisons, correspondence, and renewals are possible exposed workflows. Ask whether faster administration improves service or enables customers and competing distributors to replace part of the offering. This category ranks first under the alternate task model.
3. Nondepository Credit Intermediation - NAICS 5222
Credit paperwork, analysis, and servicing create information-intensive work. The index does not measure lending losses, funding risk, or borrower quality. Investigate human review, process accuracy, and who retains the benefit of faster processing.
4. Insurance and Employee Benefit Funds - NAICS 5251
Benefits administration and financial records can contribute to exposure. This category is not synonymous with a conventional small business available for acquisition. Its high placement is evidence that the broader research universe includes institutional activities.
5. Insurance Carriers - NAICS 5241
Claims, underwriting support, policy documentation, and customer communications are plausible channels. The index does not quantify underwriting performance, capital requirements, or profitability. Separate process capacity from the economic risk being insured.
6. Accounting, Tax Preparation, Bookkeeping, and Payroll - NAICS 5412
The combined category contains several service models. Compare data preparation, reconciliation, recurring compliance, review, and advisory work. Faster production can increase fixed-fee capacity or weaken hourly billing; the score does not determine which outcome occurs.
7. Grantmaking and Giving Services - NAICS 8132
Grant applications, proposal assessment, reporting, and donor communications can involve exposed information work. Many organizations in this category have missions and governance structures unlike ordinary acquisition targets. Employment exposure does not measure mission impact or funding resilience.
8. Management, Scientific, and Technical Consulting - NAICS 5416
Research, analysis, presentations, and document preparation are possible exposed activities. The buyer question is whether clients pay for production hours, proprietary knowledge, accountable implementation, or results. The industry average cannot separate those models.
9. Business Support Services - NAICS 5614
The broad category includes differing administrative and support businesses. Review the actual mix of information processing, customer interaction, and operational delivery. Its ninth-place main rank and second-place task rank show that exposure-model choice can meaningfully change ordering.
10. Office Administrative Services - NAICS 5611
Administrative staffing is directly relevant to the offering. Investigate workflow standardization, exception handling, data access, and customer willingness to manage work internally. Exposure does not establish that the service is substitutable at acceptable quality and cost.
11. Management of Companies and Enterprises - NAICS 5511
Corporate headquarters and holding-company activity can have information-intensive staffing. This is not a direct ranking of the operating subsidiaries those organizations own. Do not transfer the headquarters score to a portfolio company without examining that company's workforce.
12. Advertising, Public Relations, and Related Services - NAICS 5418
Drafting, research, creative iteration, and reporting can be exposed while relationships and strategic judgment still matter. Examine whether cheaper output strengthens delivery margins, expands scope, or increases price competition. The category is broader than a single marketing agency model.
13. Sound Recording Industries - NAICS 5122
The index reflects occupational composition, not a current audio-generation benchmark. Production, commercial coordination, and creative work can face different effects. Investigate what is sold: production services, rights, distribution, or trusted creative direction.
14. Business, Professional, Labor, Political, and Similar Organizations - NAICS 8139
Member communications, policy materials, administration, and research can involve exposed work. Revenue and membership depend on additional factors the index does not measure. This combined category should not be treated as a homogeneous commercial acquisition market.
15. Radio and Television Broadcasting Stations - NAICS 5161
Content preparation and related information work can contribute to exposure. Audience relationships, local reporting, distribution, and advertising economics remain separate questions. The task alternative places this category eighth rather than fifteenth.
16. Social Advocacy Organizations - NAICS 8133
Research, communications, and administrative functions are plausible channels. The ranking does not measure effectiveness, political influence, donor demand, or organizational continuity. Use it to inspect workflows rather than infer financial distress.
17. Freight Transportation Arrangement - NAICS 4885
Coordination, shipment documentation, quote preparation, and communications may be exposed even when goods still move physically. Distinguish arranging transportation from providing the transport assets. Examine reliability, exceptions, relationships, and any customer shift toward self-service.
18. Religious Organizations - NAICS 8131
The national workforce mix includes administration and language-intensive roles. The task alternative ranks the category thirty-eighth, a substantial change. Neither model measures trust, community ties, attendance, or the quality of pastoral work.
19. Architectural, Engineering, and Related Services - NAICS 5413
Drafting support, calculations, documentation, and project information can be exposed while site constraints and professional responsibility remain material. Evaluate the task and review process separately. A four-digit average cannot isolate a particular engineering specialty.
20. Offices of Physicians - NAICS 6211
Exposure can reflect both information-intensive professional work and administration. It does not establish clinical replaceability or reduced patient demand. Scheduling, documentation, and billing should be distinguished from accountable care. The alternative model places this category twenty-eighth.
21. Specialized Design Services - NAICS 5414
Design-production workflows can be exposed, but the category includes different specialties. Investigate whether the customer buys output volume, original direction, implementation, or brand knowledge. This is not a graphic-design-only ranking.
22. Offices of Other Health Practitioners - NAICS 6213
The industry combines several practitioner types and support roles. Examine the specific service and office processes instead of assuming a common automation effect. The task model moves it outside the top 25, to thirty-second.
23. Professional and Commercial Equipment Wholesalers - NAICS 4234
The physical product can coexist with information-intensive sales support, purchasing, and administration. That creates a useful distinction between exposed labor and exposed revenue. Inventory, distribution relationships, and technical service are not measured by the workforce index.
24. Community Food, Housing, and Relief Services - NAICS 6242
Support work can be information-intensive even when frontline services occur in person. Funding, service demand, and mission delivery remain outside the index. This category reinforces why the list is an exposure benchmark rather than a set of recommended businesses to buy.
25. Electronics and Appliance Retailers - NAICS 4492
Product information, sales support, and administrative work can be exposed while merchandise and delivery remain tangible. Separate workflow efficiencies from customer demand, inventory risk, pricing, and competition. The task model places the category nineteenth.
How the broader ranking is calculated
Start with the BLS May 2025 national industry staffing file. Retain private-ownership, genuine four-digit NAICS categories and use detailed occupation rows only. After excluding composites, broader rollups, and government designations, the file supplies 211 industries. Government employment totals remain source statistics. [S1]
Join occupational employment to the authors' language-modeling exposure scores through the disclosed SOC crosswalk. Calculate an occupational percentile within the original exposure dataset, then take its employment-weighted average among matched occupations in each industry. This normalization expresses relative occupational exposure and does not turn the underlying index into task shares. [S2, S3, S5]
In symbols: broad exposure points = sum(matched occupation employment x occupational exposure percentile) / sum(matched occupation employment). Percentiles are on a 0-100 scale. Unlike the earlier customer-facing contribution score, this measure includes every matched occupation and normalizes to covered employment. It must not be directly compared with the earlier contribution score as though the scales were identical.
For the alternate task model, use Eloundou et al.'s human_rating_beta occupational data restricted to .00 records, convert to occupational percentiles, and weight by matched industry employment. No unweighted averaging of O*NET specialties is used. Both occupational exposure sources are academic primary research, not official government AI-risk indices. [S4]
Qualification requires at least 85% of industry employment matched to each of the main and task-alternative sources. The same 137 industries are used for both headline and alternate ranks. Higher scores sort first, with minimum ranks for any exact ties. The top 25 are selected before rounding displayed points to one decimal place.
The language model links AI applications to O*NET abilities; the task-based alternative uses a different construct. Both use occupational foundations, so agreement is not fully independent validation. This edition changes the analytical scope; it does not refresh the old capability measures to October 2026 technology. [S2-S4, S7]
Why some seemingly obvious industries are unranked
Software publishing, computer systems design, and travel arrangement remain visible in the complete dataset but fail the joint coverage rule. This is a limitation of the matched evidence. Occupational mergers, newer classifications, unavailable scores, and suppressed detailed staffing can all reduce coverage.
A one-parent SOC split can inherit the older exposure value under the disclosed rule. A merged occupation with multiple older parents is omitted because its employment weights are unavailable. Missing staffing is not assigned a substantive exposure score of zero. The downloadable data identify the reason for each unranked row.
The 85% threshold is an author-set reporting rule, not a validated confidence threshold. It prevents publication of highly incomplete headline comparisons but cannot remove selection bias. The threshold sensitivity above makes that selection effect visible.
Missing-data bounds and uncertainty
The headline score averages observed matched employees. If omitted occupations differ systematically from matched occupations, the result can be biased in either direction. To make that issue inspectable, the data also publish an observed-contribution lower endpoint and a missing-data upper endpoint using total employment as the denominator.
Lower endpoint = headline exposure points x main coverage fraction. Upper endpoint = lower endpoint + 100 x uncovered employment fraction, capped at 100. These bounds assign omitted employment the lowest or highest possible percentile score. They are conservative sensitivity envelopes, not statistical confidence intervals; their endpoints do not forecast business outcomes.
The download also includes ranks using the original raw language index and the image-generation index. Image exposure is a different modality, not a newer version of the language model. The best/worst rank across the four stated specifications is available for every qualified industry. No range accounts for all uncertainty, including BLS sampling, subjective roles, staffing changes, source age, or the evolution of AI capabilities.
What a business buyer can do with the benchmark
Map the target's actual employee and owner tasks before applying an industry average. Identify which exposed work is sold to the customer and which supports delivery. Separate routine production from exceptions, accountable review, physical execution, and relationships. Then examine evidence of pricing, retention, quality, capacity, and costs.
Keep any proposed improvement separate from verified historical earnings. Exposure points do not supply a cash-saving rate or a revenue haircut. A faster workflow may create spare time without reducing payroll or generating additional demand. A target may already have captured the gain, making a second adjustment double counting.
The companion report, AI Office-Efficiency Opportunity in Physical-Service Businesses, remains a separate support-work analysis. Its 83-industry cohort and opportunity points answer a different question. Use the broad report to locate occupational exposure, then use workflow evidence to investigate its possible business channel.
Publication and citation guidance
The most defensible headline is: 'Buyer School identifies the top 25 occupationally AI-exposed industries in a 137-industry, coverage-qualified comparison.' Avoid 'the 25 businesses AI will destroy,' '87% of legal revenue is at risk,' or an unqualified claim that every U.S. industry was ranked.
The full data, exclusions, alternate ranks, thresholds, methods, and calculation scripts accompany the report. Public publication should include accessible full-text HTML, real table text, source links, and downloadable files alongside the PDF. These assets make the findings inspectable and reusable, but do not guarantee search visibility, AI citation, or publisher coverage.
Educational scope and disclosure
Buyer School is an educational research site. This report provides general information and modeled comparisons, not individualized investment, lending, legal, tax, employment, or acquisition advice. It does not recommend purchasing or avoiding a particular business. Verify material assumptions using target-company records and qualified professionals before acting.
Buyer School produces acquisition education and may benefit commercially from readership. The report was prepared with AI assistance and programmatic calculations from public sources. It has not received independent practitioner or academic review. The staffing data cover firms of many sizes and exclude self-employed workers; the report does not isolate small businesses for sale. Owner work, contractors, outsourced support, task variation, wages, and implementation readiness remain material gaps.
Version and suggested citation
Edition 2.0, October 4, 2026, broadens the original customer-facing report to all qualified industries. It preserves the source snapshot and matching rule, changes the headline metric, and adds the top 25 and threshold sensitivity. The earlier nine-industry metric remains a supplementary legacy field in the dataset and must not be described as the main ranking.
Suggested attribution: Buyer School (2026), AI Exposure Across U.S. Industries: The Top 25, edition 2.0, October 4. Buyer School modeled estimates using BLS OEWS May 2025 and published occupational exposure measures. Cite the public report, methodology, and dataset URLs after publication.
Sources and attribution
- [S1] U.S. Bureau of Labor Statistics, Occupational Employment and Wage Statistics, May 2025 national industry staffing tables. bls.gov/oes/tables.htm; downloaded file: oesm25in4.zip. Private ownership, detailed occupations, strict four-digit NAICS only.
- [S2] Felten, E., Raj, M., and Seamans, R. (2021). Occupational, industry, and geographic exposure to artificial intelligence: A novel dataset and its potential uses. Strategic Management Journal 42(12), 2195-2217. doi.org/10.1002/smj.3286. Author data: github.com/AIOE-Data/AIOE. The research is a primary academic source, though not a government measure.
- [S3] Felten, E., Raj, M., and Seamans, R. (2023). How will Language Modelers like ChatGPT Affect Occupations and Industries? arxiv.org/abs/2303.01157. Language and image exposure workbooks supplied by the authors. The main model uses their language-modeling occupational scores, not their already-aggregated industry rankings.
- [S4] Eloundou, T., Manning, S., Mishkin, P., and Rock, D. (2023). GPTs are GPTs: An Early Look at the Labor Market Impact Potential of Large Language Models. arxiv.org/abs/2303.10130. Author replication data: github.com/openai/GPTs-are-GPTs. Sensitivity uses human_rating_beta from data/occ_level.csv, restricted to .00 occupational records; no averaging of O*NET specialties without employment weights.
- [S5] BLS, 2010-to-2018 SOC crosswalk. bls.gov/soc/2018/crosswalks.htm. Download: soc_2010_to_2018_crosswalk.xlsx. Ambiguous multiple-parent mappings excluded.
- [S7] O*NET Resource Center, database and content model. onetcenter.org/database.html. Provides occupational information underlying the academic models. This study does not rerun the original model on the current O*NET release.
How to cite this research
Buyer School (2026). AI Exposure Across U.S. Industries: The Top 25, edition 2.0, prepared October 4, 2026. First published October 5, 2026. Business Buyer School. https://businessbuyerschool.com/research/ai-exposure-by-industry/. Buyer School modeled estimates using BLS OEWS May 2025 staffing and published occupational exposure measures.
- Author and publisher: Buyer School Research, the research imprint of Business Buyer School (businessbuyerschool.com), operated by Dig Inc LLC. Organizational authorship; no individual author is named.
- Attribution: describe scores, ranks, coverage figures and cohort counts as "Buyer School modeled estimate". Employment totals are BLS statistics.
- Review status: prepared with AI assistance and programmatic calculations from public sources. Not independently peer reviewed. No DOI has been assigned.
- Reuse: a data license has not been published. Short quotations of findings with attribution and a link to this page are welcome.
- Corrections and versions: see the version history. This URL stays stable across editions.
Downloads
- Report PDF: AI Exposure Across U.S. Industries: The Top 25, edition 2.0 application/pdf
- Top 25 ranked industries (CSV, 25 rows) text/csv
- All 137 ranked industries (CSV, 137 rows) text/csv
- Full dataset, 211 industries including 74 unranked (CSV) text/csv
- Full dataset, 211 industries (JSON, generated from the CSV at build time) application/json
Files are edition 2.0 and stay at these addresses unchanged. This page is the primary version of the report; the PDF is a copy for download.
Related research
AI Office-Efficiency Opportunity in Physical-Service Businesses uses a different construct and an 83-industry cohort. Its opportunity points are not on the same scale as exposure points and the two should not be combined into one ranking.
Methodology · Dataset and full ranking
Business Buyer School teaches first time buyers how to evaluate a small business. About the school.